Blog
Why monitor mine, construction and quarry dust in real-time?
Article Details
Last Updated
23 April 2024
Published
02 July 2015
Category
Construction
Introduction
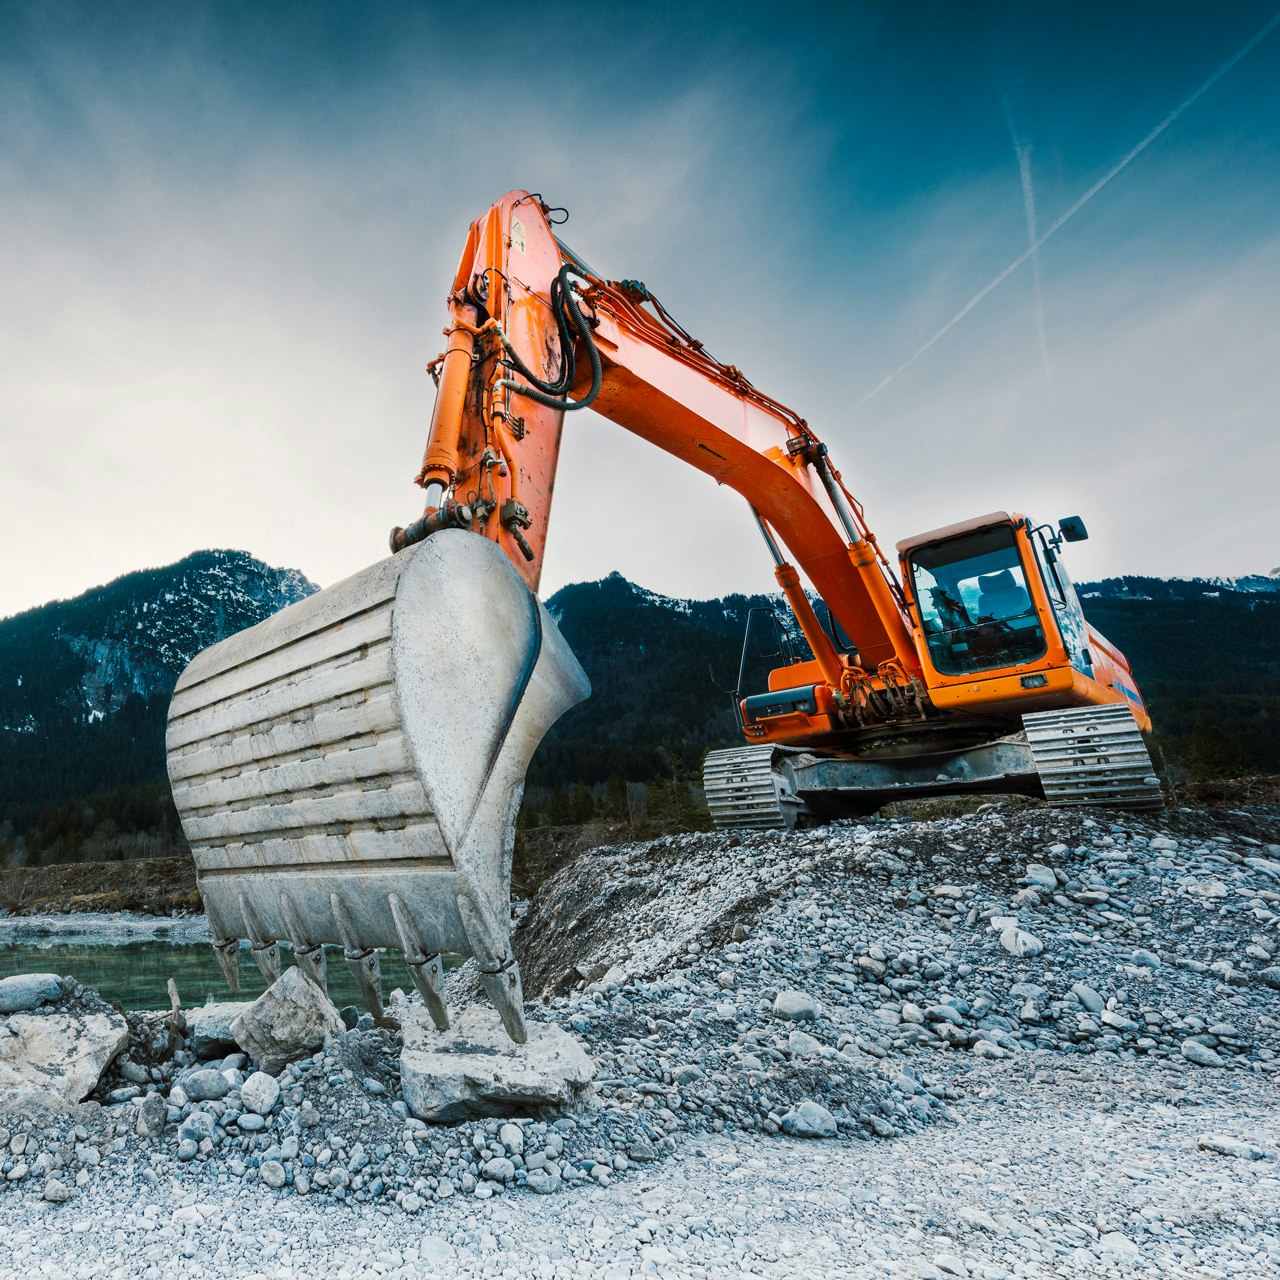
Quarries, rock crushing operations, major earthworks and open cast mines are by nature a dusty business. Unearthing and moving thousands of tonnes of soil and aggregate each day results in high levels of dust on-site and at the boundary. For sites bordering populated areas, fugitive dust emissions can become a source of tension between site managers and the community.
What is dust anyway?
Dust is comprised of many different things of many different sizes. Usually we talk about dust in terms of particle sizes and particle sizes are measured in microns (a human hair is about 50 microns thick). A more scientific term is Particulate Matter (PM). Particles 10 microns and less are known as PM10 (i.e. particle matter 10 microns and less). Particles 2.5 microns and less are known as PM2.5. Total suspended particulate (TSP) is a measure of all the particles suspended in the air and is often what is referred to as “dust”.
Community concerns often arise from the dust they can see and taste. Dust to most people is the stuff that catches in the throat, irritates the eyes, and settles in a film on cars and windows. This is caused by larger particles, those 10 microns and above, and is often referred to as “nuisance dust”. As well as being a nuisance this sort of dust can and does have a significant health impact. Increasingly communities are aware of the health impacts of smaller particles too, even if they can’t see them. Smaller particles tend to come from combustion sources – diesel engines are prime source of smaller particles e.g. 2.5 microns and less.
Measuring both small and large particle fractions is becoming increasingly important. For a fuller explanation of why it’s important to monitor PM, please see the following blog post.
Traditional compliance monitoring
Traditional compliance monitoring involves regular sampling of dust. Most compliance monitoring involves a high-volume dust sampler. The advantage of the high volume sampler is that it is robust and has low capital costs. This helps to explain why high volume sampling is the most widely used method of compliance monitoring.
High-volume air samplers typically sample more than 1500 cubic meters (m3) of air over a 24-hour period. The sample is passed through a filter which must be removed then sent off for analysis. The filter paper is weighed and a dust level is determined from the weight of the filter paper. The dust level is recorded and reported to the regulator when required.
High volume samplers measure TSP, or PM10, or PM2.5. The size fraction is selected for by means of a physical separator on the inlet of the instrument. The only way to measure multiple sizes is by having multiple high-volume samplers which is usually beyond the budgetary means of most site managers.
Drawbacks of traditional compliance monitoring
Traditional compliance monitoring is slow. The whole process – from sampling, to collection, to sending the filter off for analysis can take days, if not weeks. The method is good at reporting what the average dust levels were on any given day in the past, but they cannot tell the site or community what the dust levels were at 10 am on Sunday morning, for example. A high volume sampler would simply report the average for the day.
When disputes occur the community is likely to have a specific event or events in memory when the problem was particularly bad. They will confront the site managers with dates and times and often pictures of the worst moments. Answering these concerns with an averaged sample over a 24 hour period is insufficient. Sometimes the sample has not even been sent to the lab by the time the neighbours are demanding an answer.
Another disadvantage of high volume samplers is the operating cost. Sending someone to change the filter, send the old one off to the lab, and to pay the lab for analysis adds significant ongoing expense to the monitoring program.
For these reasons continuous monitoring is seen as the next step up in terms of compliance.
Continuous dust monitoring – TEOMs and BAMs
Continuous compliance monitoring is often required on sites where more stringent reporting is required. Usually more stringent reporting is required as a result of tensions with the community. The advantage of continuous monitoring is that dust levels can be reported to within a one hour time period.
Examples of continuous ambient dust monitors include the tapered element oscillating microbalance (TEOM) and beta attenuation monitor (BAM). Both have their strengths and weaknesses. have high precision compared to high volume samplers (± 0.5 µg m-³). BAMs are popular in some parts of the world but are banned in others due to the fact they contain a radiation source.
TEOMs and BAMs have two general advantages compared to high volume samplers:
- They offer data at higher temporal resolution. They can be configured to report data as hourly averages rather than daily averages which means data from one part of the day can be compared to data from another part of the day.
- The methods do not require manual intervention to weigh a filter. These instruments can run automatically for longer periods of time compared to the Reference methods so the operational cost is lower.
TEOMs and BAMs also have some general disadvantages:
- Most instruments require additional sheltering from the weather. They are not ready for installation out of the box. This requirement adds installation cost for these instruments.
- Although these methods provide higher temporal resolution, they cannot provide minute by minute resolution so they are not suitable for applications which require some kind of response to a dust event.
It is this second point that explains why in the last few years mines and quarries have been looking to real-time methods such as nepthelometery to complement their compliance monitoring requirements.
Real-time dust monitoring
The benefit of real time monitoring is that you know how much dust is in the air in real-time – minute by minute. The operational advantages of real time monitoring are considerable. The monitor can trigger an alert the very minute that dust levels increase beyond an acceptable level. This gives the site manager a chance to respond by putting in place dust control measures such as water sprinklers – before the problem gets out of hand.
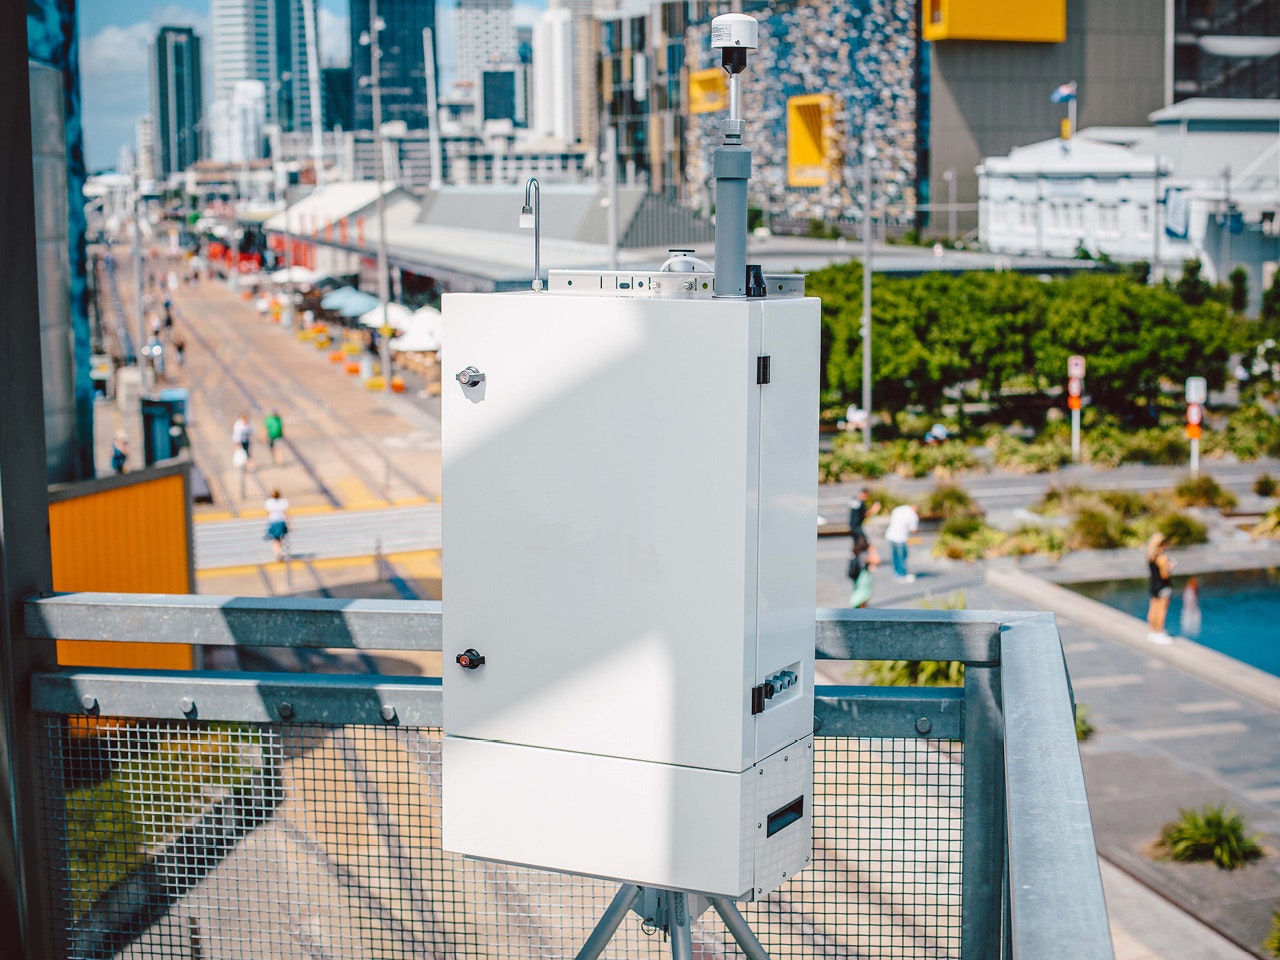
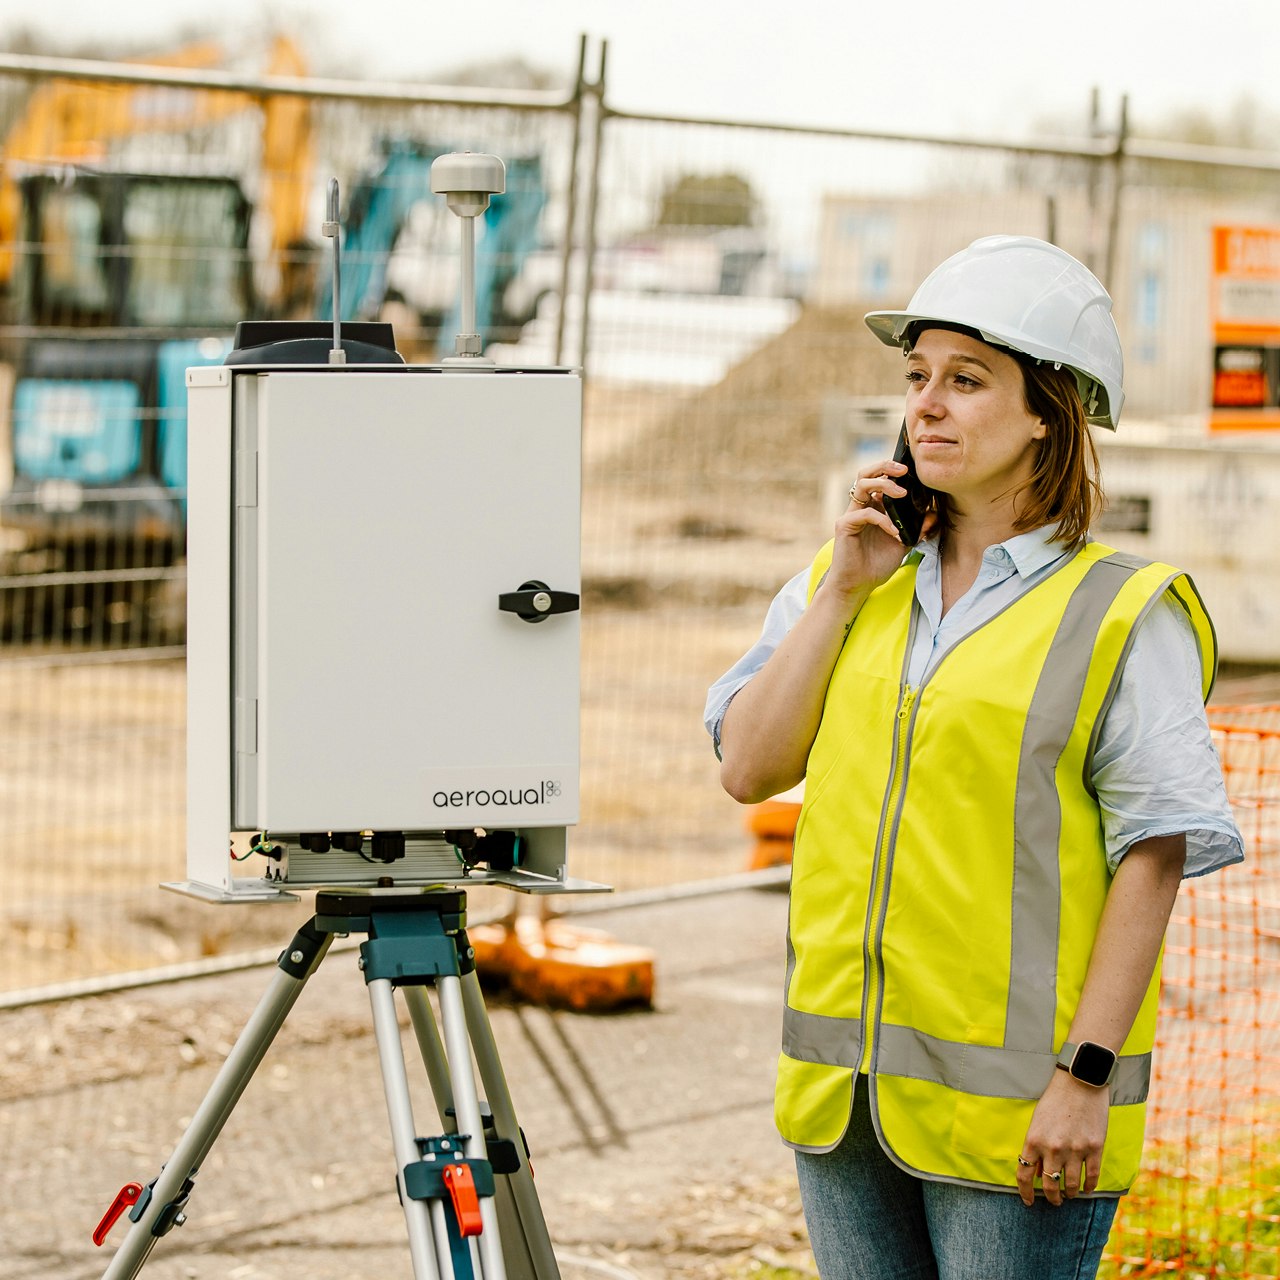
Many real-time dust monitors on the market, such as Aeroqual’s Dust Sentry and Dust Profiler, are able to send SMS/text alerts out to nominated site managers. The site managers will be alerted to a problem and can implement dust control measures. Many real-time dust monitors can be linked to a strobe or siren via a relay output. Going further the real-time monitor can be hard-wired into the mine management system, triggering dust suppression equipment in the event dust reaches a pre-determined level.
Real-time dust monitoring hands control of the situation back to site management. Rather than waiting days or weeks to know if there’s been a problem, real-time dust monitoring allows an immediate response. Real-time monitors like the Dust Sentry are lightweight and can be moved from location to location. They can be paired with environmental sensors for wind speed and direction or noise, and the data can be made instantly available to authorized users via the internet.
Dust monitoring regulation is changing
The operational advantages of real-time dust monitoring help to explain the recent shake up in dust monitoring legislation. Greater London has required real-time dust monitoring around construction sites for several years. The Ministry of Environment in UAE recently introduced controls on quarry and crushing operations. More and more local councils are requiring mines and quarries to install at least one real-time dust monitor to support the mandatory compliance monitoring activity.
Real-time monitoring works well in support of traditional compliance monitoring equipment. The compliance monitor maintains the absolute record of dust levels on a day to day basis. The real-time monitor can be used as an operational tool to manage dust levels before they get out of hand. By having a compliance monitor on site and periodically calibrating the real-time monitor against it, the data coming from the real-time monitor will be robust and accurate.
An example from Dustville, USA
The following example is fictitious but based on real world customer stories.
Imagine that you run a gravel and sand operation that borders a small town, Dustville. Dustville is on the south west boundary. Several of the residents have complained to the local council about dust landing on their properties and say the problem is at its worst around 4 and 5 pm each day especially in the summer. The compliance monitor, a high volume sampler located next to the site office which is at the northern end of the site, consistently reports dust levels within an acceptable range. The council is happy that the compliance monitor is doing its job, but they are under pressure from the community to respond their concerns. What do they do?
The site manager contacts an environmental consultant who recommends the installation of a real-time dust monitor on the south west boundary. The real-time monitor can be rented from a local supplier for a few weeks at a reasonable price, and the set up seems low hassle, so the site manager decides to give it a try. The consultant also recommends the inclusion of a wind speed and direction sensor, and a modem that will send SMS alerts to the site manager and the consultant in real-time. The consultant calibrates the real-time monitor by operating it side by side against the high volume sampler for several days which gives everyone comfort of the measurements. Then they move the real-time monitor out to the south west boundary and set the alarm level to 80µg/m³.
The very next day after the monitor is installed, at 4.34 pm, the site manager gets a text message. The real-time monitor is reporting levels of 139µg/m³. Surprised the site manager goes to check it against the high volume sampler, but of course the high volume sampler can’t tell him anything. The filter is not due to be changed for another four days and the results from the lab won’t be back until mid next week. He gets a call from the consultant who got the message too, and they agree to meet at the monitoring site on the south west boundary.
By the time they get to the boundary the real-time dust monitor is reporting levels back below 80µg/m³. There are no visible signs of any problem. The consultant looks up the data online using his smartphone. They see that the readings hovered above 80µg/m³ for about half an hour with spikes well over 100µg/m³. They also notice that the predominantly north east wind is elevated at this time with gusts up to 40 mph. There is a strong correlation between these gusts and the dust level spikes registered by the real-time monitor. They agree to monitor the situation over the next few days.
After a week of readings they see there is a clear relationship between wind speed, wind direction, and dust level alerts. The north east wind in Dustville tends to pick up in the afternoons. On days when it’s calm or the wind blows from the opposite direction the real-time monitor sends no alerts.
Armed with this information the site manager goes to the council and they agree a change to the site operational plan which will see crushing operations cease when the wind comes from the north east and blows above 20 mph. After a few weeks complaints from Dustville residents have completely ceased.
The above example is typical of the experiences many site operators have had. For some real-life experiences please check out the following customer case studies:
Air monitoring made easy
Take the time and hassle out of your next project with a real-time air quality monitoring solution.


