


Blog
What is an air quality index and what are the benefits?
Article Details
Last Updated
30 March 2024
Published
01 April 2016
Category
Outdoor
Air quality data can be complex
Air quality data is often complex and confusing – there are multiple pollutants, several units and all sorts of different standards. All of these factors take professionals a while to get their heads around, and these are people that work with data and instruments every day!
The challenge is therefore to convert all this valuable data being collected every minute around the world, into a format that is engaging and understandable for everyone – something which everyone can use to assess the impact of air quality on their day to day activities, their environment, and most critically their health.
An Air Quality Index allows complicated data to be communicated in a meaningful way to everyone, in a way which everyone can understand easily.
What is an air quality index (AQI)?
Air quality indices have been around since the 1970’s, and were pioneered by the United States’ Environmental Protection Agency (USEPA). They use simple formulae to convert ambient air quality data into classifications. Two broad types exist: those using an air quality standard to determine the classification, and those using health impacts to determine the classifications.
All Air Quality Indexes present their data in using the familiar ‘traffic light’ scale, with lower classifications coloured green (low), and the higher concentrations coloured orange or red (severe). AQI are designed to be used by the public, so they can make decisions about their modifying their activities based on air quality.
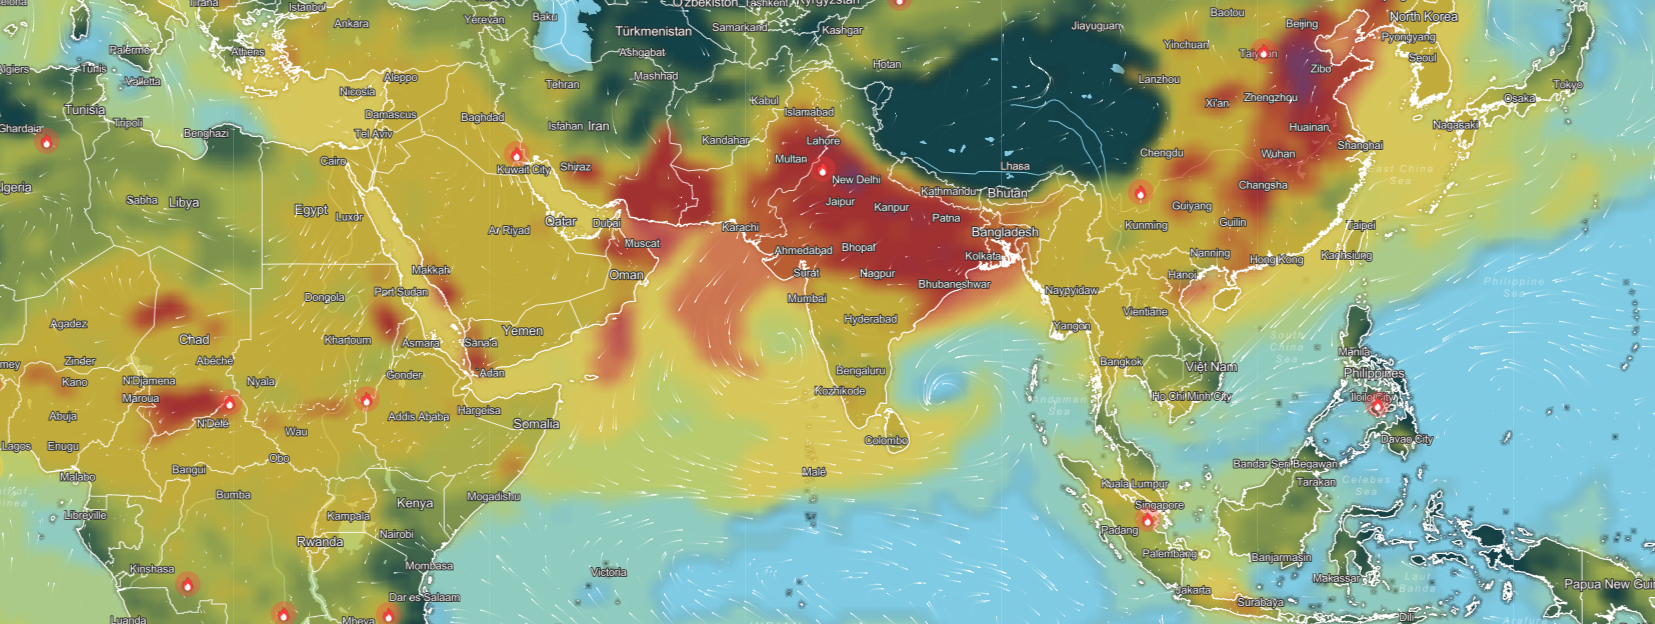
Usually AQI are available on-line and in real-time. Often the data is presented using graphs and tables, and in some cases maps. These websites publish AQI from ambient air quality monitoring sites all around the world – have a look and see if your city is available!
In some areas, AQI are used to predict air quality. Future air quality is modelled, using current levels, to produce reasonable predictions for air quality a few days ahead. If you have access to forecast AQI, then you can assess the suitability of your planned activity given the air quality expected on that day. For example, if you live somewhere prone to dust storms, a forecasted AQI may be able to tell you that PM levels might be elevated on a day when you have outdoor activities planned.
Who uses AQIs?
Most countries and their environmental regulators operate AQI, all of them with some differences. AQI may be calculated and presented at a local scale such as a City, or at State or Country levels. Their bands will differ from region to region, depending on their local conditions. Some AQI are based purely on concentration range, while some are based on the health impacts at given concentrations. Let’s have more detailed look at a few examples:
USA
The USEPA’s AQI uses a formula, to convert ambient concentrations from instruments, to a scale from 0-500, classified as Good to Hazardous. The scale is based on the USEPA’s standards for ambient air and their health effects. The USEPA AQI also provides advice for sensitive groups, like people with asthma, and the elderly, suggesting that they modify their daily activities when the AQI is in the higher classifications.
The Air Quality Index is calculated for all pollutants at a monitoring site, and the highest (worst) AQI for the site is reported as the AQI for the site. Usually the AQI value for all pollutants at the site is reported. You can find out more here. The USEPA method is common around the world, being used in Australia and Europe.
UK
In the UK, Department of Environment Food and Rural Affairs (DEFRA) publishes a Daily Air Quality Index (DAQI). The DAQI is different as it uses the health impacts of pollutants to create the index bands. The bands are based on real findings from health studies. The DAQI also provides recommendations for the general population, and advice for at risk individuals.
This allows people to adjust their daily activities in times of poor air quality. For instance, you might choose to keep children inside, or delay some exercise outside when the index is in higher bands. You can find out more about the DAQI here and view the DAQI data here.
British Columbia, Canada.
Similar to the UK index, the British Columbia AQHI (Air Quality Health Index) uses health impacts from epidemiologic studies to convert current AQI into a score out of 10 – with 10+ corresponding to the worst air quality. The bands correspond to health impacts, with the higher bands corresponding to higher health impacts. Specific advice for lower and higher risk individuals is also given, so people can adjust their activities accordingly.
India
Recently India launched an AQI. The Indian AQI uses bands, based on concentrations of the highest pollutant. The index uses the Indian Air Quality standards to convert concentrations into and index, and gives health advice based on the AQI band. The Indian AQI does not differentiate between sensitive and less sensitive groups, but comments that more sensitive groups are more susceptible at the higher index bands. See the Indian AQI here.
Benefits of an air quality index
The key benefit of using an AQI is the ability to communicated data with the public, both easily and conveniently. AQI can demystify data – you don’t need to be an expert to understand AQI values – they’re easily scaled and colour coded – there is no need to understand units and concentrations. Often data are communicated in relation to a standard – but this approach assumes that people understand that there are no safe limits for concentrations, and that just because concentrations are below a guideline doesnt mean that there are no health impacts.
Transforming your data into something the public can understand is really valuable – you retain your traditional dataset, and for minimal effort and calculation you can present it in an understandable and recognisable form for everyone.
AQI calculations are very straight forward – often they are as simple as assessing what range of values a concentration falls in. Accordingly they’re very easy to display on websites or in real time on a screen. Since many AQI are calculated on the highest pollutant concentration, you can calculate an AQI using a single pollutant – so if your network of sites has a bit of variation is not a problem – you can still create a useful AQI from the data you have.
Which air quality index is best for you?
If your local air quality regulator has an AQI, then it may be sensible to use their AQI, as this will allow you to demonstrate your level of compliance with an existing AQI. Similarly, if there is an existing, well-known AQI in you region, this can be a quick way to generate interest and support for your monitoring project.
If your project is specifically concerned around assessing health impacts of pollutants, then you might like to consider using a health based AQI, like the AQHI or DAQI. This would allow you to make an assessment of health impacts in near real time. Make sure that the AQI you select is appropriate for the concentrations you anticipate to measure – otherwise your results will be skewed.
If you’re using an AQI which uses the local guidelines and standards, like the USEPA AQI, then check that the standards you are using are correct for your local area. If you can’t find an index that works for you, then you can easily calculate your own – simply calculate your pollutant concentration as a percentage of your local guideline or standard.
AQI are easy to publish. Many agencies publish their data on line, but the ease of publication means that it’s simple to publish your AQI data in newspapers or embedded in your existing websites. By publishing in multiple places you reach and engage more people, and using and AQI your message will always be consistent and understandable for the public.
How can Aeroqual help you with an air quality index?
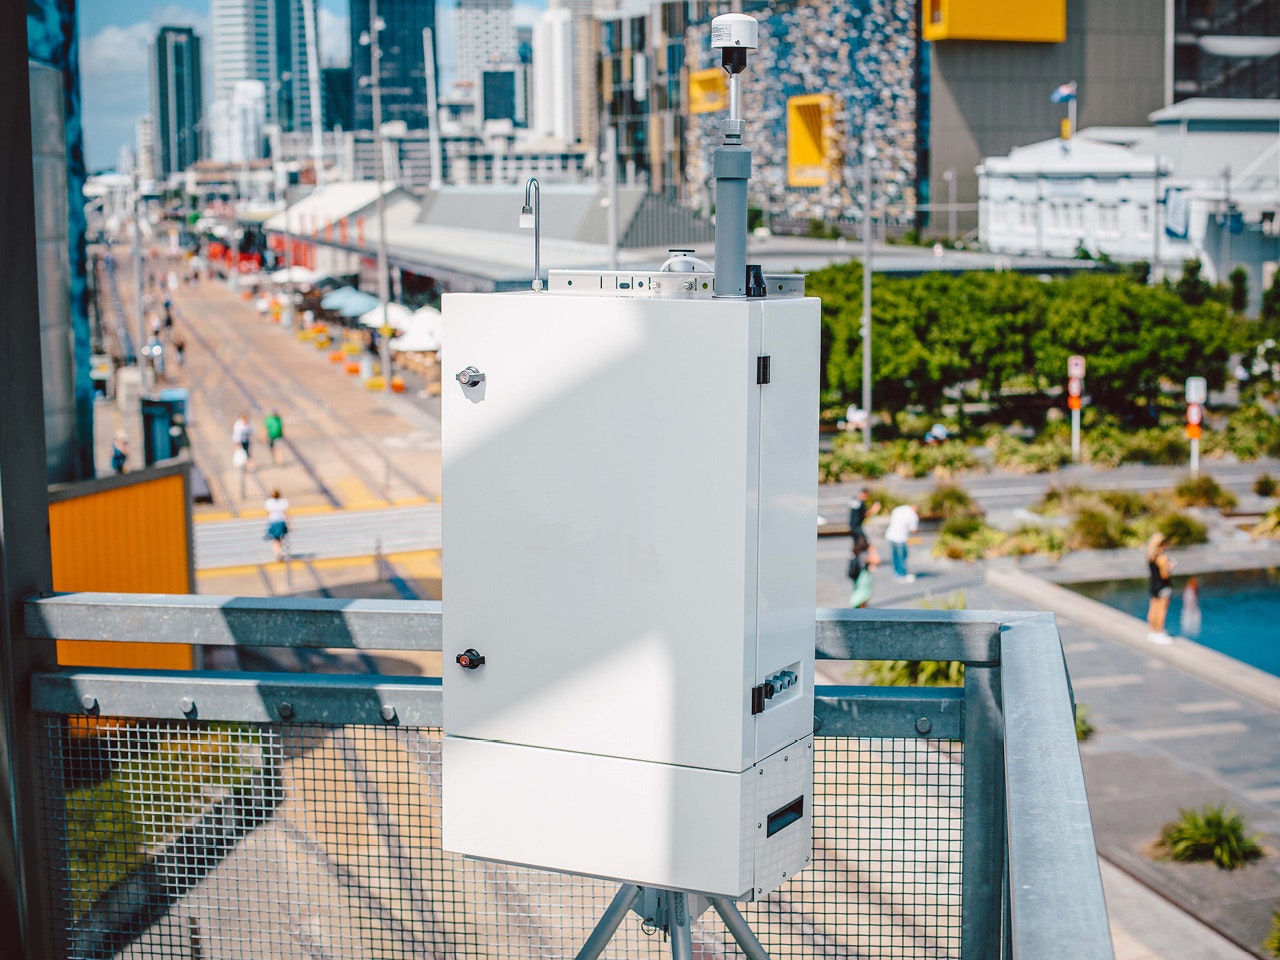
Once you’ve decided on which AQI you’re going to use, Aeroqual can help you with the measurement. Our modular, flexible systems allow you to get set up and measuring quickly. You can use the data from our AQM65 to calculate an AQI for all the parameters you’re measuring – and you may even be able to calculate it for parameters which you’ve never measured before or in areas which you’ve never measured before.
In the context of industrial hygiene monitoring, Aeroqual Ranger offers precise hyper-local air quality data in a highly portable device. Relying solely on publicly available data risks getting an inaccurate reading of site-specific pollution. This could result in being blamed for the action (or inaction) of a neighboring site or other cause of pollution in the area, leading to potential fines, shutdowns, and delays. With Ranger, IH professionals can simultaneously measure several key criteria pollutants in real-time. More localized data allows site operators and consultants to better address airborne hazards, maintaining compliance, protecting worker health, and achieving industrial hygiene goals.
Aeroqual Cloud allows you to access your data easily, and download for calculation of AQI. With Aeroqual Cloud, your data is always available, and can be flexible averaged for AQI calculation at multiple scales.
If you’re interested in publishing an AQI for your area, Aeroqual can help you by providing flexible monitoring solutions, allowing you to monitor and report an AQI for areas and pollutants where you may never have monitored before.
Got AQI questions?
Aeroqual can help you publish an AQI in your area